
Celtics
Leaders
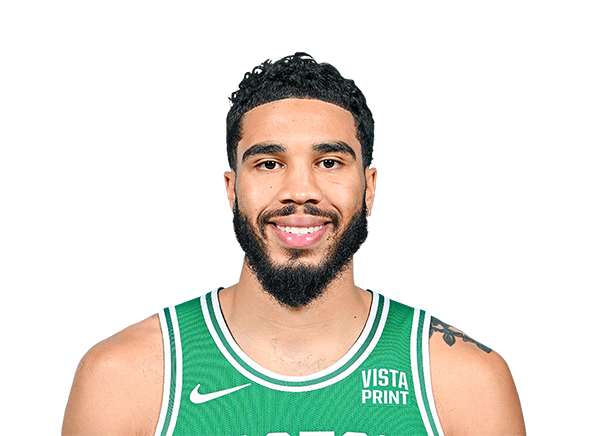
Jayson Tatum
Points
27
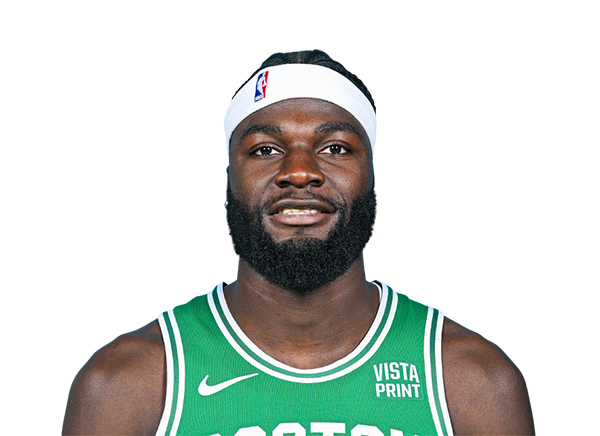
Neemias Queta
Rebounds
6.3
Jayson Tatum
Assists
7.9
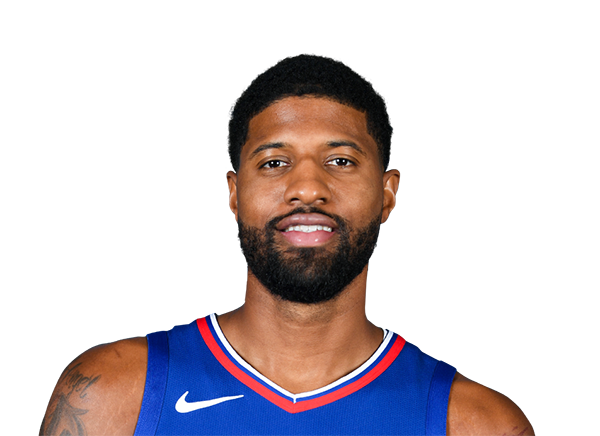
Paul George
Steals
2.6
Player Statistics
| Name | GP | MPG | PPG | RPG | APG | SPG | BPG | FG% | 3P% | FT% | TO |
|---|---|---|---|---|---|---|---|---|---|---|---|
| Jayson Tatum | 7 | 35.1 | 27 | 6 | 7.9 | 0.7 | 0.4 | 41.8 | 22.9 | 87 | 3 |
| Paul George | 7 | 31.6 | 21.3 | 5.6 | 5 | 2.6 | 0.3 | 46 | 41.4 | 80.8 | 3.3 |
| Payton Pritchard | 8 | 26.8 | 13 | 2.8 | 3.6 | 0.8 | 0.3 | 41.8 | 31 | 86.2 | 1.4 |
| Derrick White | 8 | 30.6 | 12.8 | 3.3 | 5.1 | 1.4 | 0.4 | 42.5 | 29.3 | 100 | 2.6 |
| Neemias Queta | 8 | 22.6 | 9.8 | 6.3 | 1.4 | 0.3 | 1.5 | 58.3 | 66.7 | 62.5 | 1 |
| Sam Hauser | 8 | 21.1 | 7.6 | 2.9 | 0.9 | 0.3 | 0 | 42.3 | 38.6 | 0 | 0 |
| Luka Garza | 8 | 12.5 | 7.5 | 3.1 | 1.1 | 0.5 | 0.1 | 47.5 | 52.4 | 73.3 | 0.6 |
| Baylor Scheierman | 8 | 21 | 5.9 | 4.3 | 1.3 | 0.8 | 0 | 43.9 | 45.8 | 0 | 1 |
| Mitchell Robinson | 7 | 19.3 | 5.7 | 5.3 | 0.6 | 0.4 | 0.7 | 63 | 0 | 40 | 1 |
| Jordan Walsh | 8 | 15.4 | 4.3 | 3.8 | 0.8 | 0.6 | 0.1 | 38.2 | 30 | 100 | 0.6 |
| Hugo Gonzalez | 8 | 12.8 | 3.8 | 2.3 | 0.5 | 0.5 | 0.3 | 44 | 16.7 | 66.7 | 0.3 |
| Mike Conley | 2 | 5.5 | 4.5 | 0 | 0 | 1 | 0.5 | 100 | 100 | 0 | 0.5 |
| Chris Cenac Jr. | 3 | 3.3 | 2.7 | 1 | 0 | 0 | 0 | 75 | 50 | 50 | 0.7 |
| Ron Harper Jr. | 3 | 5.3 | 1 | 0.7 | 0.3 | 0.3 | 0 | 14.3 | 20 | 0 | 0.3 |
| Dillon Mitchell | 1 | 2 | 0 | 0 | 0 | 0 | 0 | 0 | 0 | 0 | 0 |
Glossary
Standings
GP: Games Played
W: Wins
L: Losses
GB: Games Behind 1st
Home: Home Record
Road: Road Record
L10: Last 10 Games
Strk: Current Streak
PPG: Points Per Game
OPP: Opponent Points Per Game
Season Stats
MPG: Minutes Per Game
PPG: Points Per Game
RPG: Rebounds Per Game
APG: Assists Per Game
SPG: Steals Per Game
BPG: Blocks Per Game
FG%: Field Goal Percentage
3P%: Three-Point Percentage
FT%: Free Throw Percentage
TO: Turnovers Per Game
Box Score
MIN: Minutes
PTS: Points
REB: Rebounds
AST: Assists
STL: Steals
BLK: Blocks
FG: Field Goals (Made-Attempted)
3PT: Three-Pointers (Made-Attempted)
FT: Free Throws (Made-Attempted)
PF: Personal Fouls
+/-: Plus/Minus