
Bruce Cassidy isn’t like most NHL bench bosses — especially as it pertains to his musings in front of a microphone.
The Bruins head coach is rarely curt when fielding a question, and is refreshingly candid for his line of work.
Be it in a post-practice scrum or a postgame presser, many NHL coaches aren’t exactly receptive to expanding their sentiment on subjects beyond what just played out on the ice (and some coaches are even tight-lipped on those matters as well).
But what sets Cassidy apart from his other colleagues isn't just his willingness to bluntly assess a player’s shortcomings — or riff on other matters, such as Pearl Jam, baseball and Cher.
Rather, it’s his willingness to not just let the simple “eye test” be the only source of his comments regarding the state of the Bruins.
Earlier this season, when Boston’s stingy defensive structure was still prone to some Grade-A slipups, Cassidy regularly found solace in his club’s sterling underlying metrics, especially in regards to expected goals and his team’s propensity for limiting the number of chances sprouting up in front of Jeremy Swayman and Linus Ullmark.
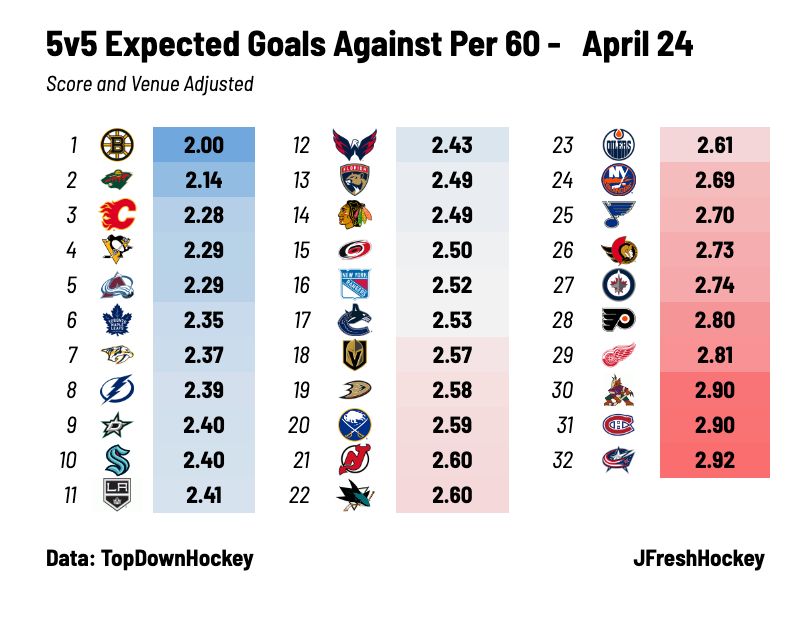
“Expected (goals) is analytics, so it’s not the whole story. But you have to put some value in it, because it does tell some of the story of how you’re playing the game, the style of play,” Cassidy said earlier this season. “So we do look at that, and obviously watch our scoring chances. Are we generating more than the other team?
“If so, are they good ones? Are they average ones? There’s kind of those grades, A, B and C. If you’re a team that doesn’t give up a lot, but gives up all grade-A’s, then it’s tough to put it all on your goaltenders.”
Cassidy is not alone when it comes to using just about every tool at his disposal when it comes to evaluating Boston's play. In wake of Boston acquiring Hampus Lindholm back in March, Don Sweeney stressed Boston’s stout expected-goals results, while also harping on the need for additional reinforcements.
“Our players currently — we’re one of the teams that probably give up one of the least amounts of expected goals, so we’ve done a good job overall,” Sweeney said. “But the depth, the impact that we needed and identified, that plenty of you have written about, was something we felt that we wanted to address.”
That emphasis on analytics and its role in offering another lens for coaches and upper-management staff to gauge play on the ice shouldn’t come as much of a surprise.
For Cassidy, the influence of analytics and its ability to cultivate effective (and especially digestible) pre-scout information and internal practice habits has only continued to grow over the years.
“It was shots on goal, plus-minus, Corsi, now it's more expected (goals),” Cassidy said of the evolution of underlying data and how it’s applied. “So I know it's been at least seven, eight years here, I want to say maybe 10, maybe it's more than that since we've got the data. How much have we used it? Probably a little bit more every year, the more the coaches dig into it, the more they can use it to their benefit."
But of course, given the demands of their gig, Cassidy and his coaching staff likely aren’t perusing through Natural Stat Trick in their spare time in order to augment their pregame prep or unearth additional context about a player’s performance.
Rather, Cassidy and Co. reap the benefits from the collaborative process forged between on-ice personnel and support staff — be it the club’s video team or, in this case, its analytics department.
It’s not always seamless, but it’s hard to argue with the results — and the unbiased insight gleaned from the data churned out by Boston’s crew of analysts.
“We'll make a few calls a year if there's a number in there that looks off. ‘Okay, how come? How do you calculate’ — at first, it was how do you calculate it, because there are a lot of different columns in there and a lot of nerds upstairs inventing new columns too,” Cassidy joked. “And good for them. It gives them something to do, keeps them busy, keeps them upstairs, not downstairs.
“But some of those columns you end up with, ‘Oh, that's a good one. I like that one.’ We have two good guys up there by the way. They're good nerds.”
As expected, there are many misconceptions when it comes to a team’s analytics department and its role in crafting information. For some fans, an analytics department is likely envisioned as nothing more than a sentient computer screen — soullessly churning out a stream of integers for a coaching/front-office staff beholden to those fancy metrics.
(Remember all of the jokes regarding the Red Sox’ “Carmine” computer system utilized by Theo Epstein?)
Of course, that’s far from the case.
The Bruins do not have HAL 9000 on the payroll when it comes to crunching these numbers. Rather, the B’s analytics department is led by Jeremy Rogalski — a West Springfield native and Bates College alum who has served as the team’s Director of Hockey Analytics since 2017. Rogalski, who has worked in various roles in the Bruins’ administration since 2009, leads a team tasked with using statistical data and tools to support Boston’s hockey operations, coaching, and amateur scouting staffs.
For Rogalski and members of his staff such as Josh Pohlkamp-Hartt (Hockey Operation Data Scientist) and Campbell Weaver (Hockey Operation Data Engineer), it’s hardly a one-way street when it comes to just how their countless hours of work is utilized.
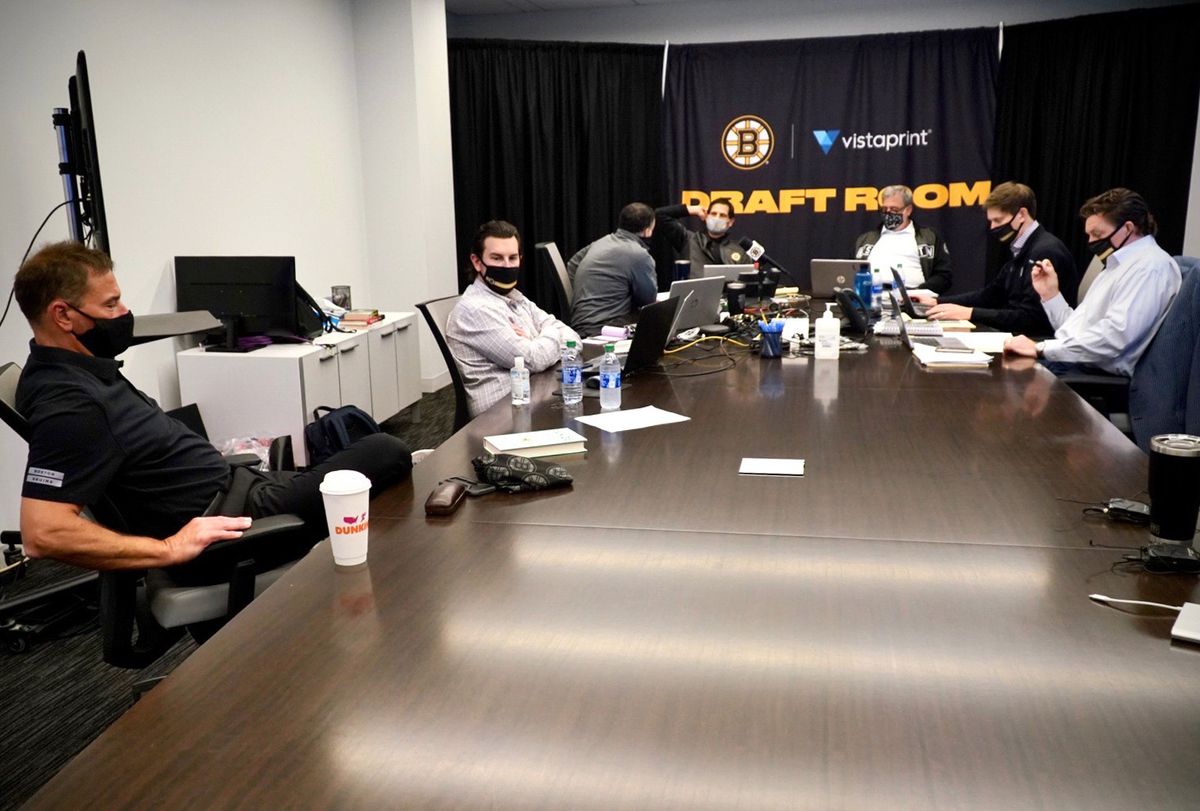
Michael Penhollow/Boston Bruins
"It’s a tool"
When it comes to how Cassidy and his staff practically apply the data given to them by Rogalski’s team, you can split it into two avenues — opposing metrics and internal metrics.
The always fantastic Shawn Ferris from Evolving Hockey and Hockey Graphs created this extremely helpful chart to showcase how both metrics are utilized by both a support staff and coaching staff.

Ahead of each game, Cassidy and the B’s coaches are already handed a bevy of information regarding their opponent — serving as an integral piece of their pre-scout work and their subsequent gameplan against that particular foe.
Of course, while the information presented to them by the analytics department is helpful, the onus then falls on Cassidy and Boston’s coaches to take that data and augment it into talking points or on-ice teachings that can be digested and embraced by the players on the ice.
Because for as much as coaches will welcome any and all additional information regarding an opponent or their own team’s play, Cassidy was frank in acknowledging that players are far less receptive to whatever conclusions can be made via some numbers on a screen — especially when used as a tool for evaluating play on the ice.
“We'll have (an opponent’s) analytics on our desk this morning, where they're vulnerable, where they're good, etc,” Cassidy said of the partnership between coaches and an analytics staff. “ And that can go to every category, so you can take as much out of it as you want. We can't go in as coaches in a pregame meeting and tell the players, 'Okay, New Jersey is 15th in neutral zone' ... you know what I mean? You'll lose the players.
“But for us, it's a tool. 'Okay, they don't defend the blue line. … I'm just using this as an example. They enter with puck possession a lot. So, okay, our neutral-zone defense tomorrow, if that's the case, needs to be really rock-solid so that we force some dump-ins, because they're not used to that. They don't generate off the forecheck. You get stuff like that to help build your gameplan.
"That's what the analytics does for the staff for the most part. Special teams, maybe they’re not good on face-offs. ‘Okay, let's make sure we dig in and help.’ Or maybe we have a set alignment, we can run a play because we know we're going to win more than we're going to lose. So we'll always get that.”
Given the number of micro-stats and other data points that can be harvested in regards to an individual player’s game, Cassidy and his staff can often pin-point specific areas where a Bruins skater needs to work on their craft — be it shot selection or finer details such as zone exits, puck retrievals and plenty more.
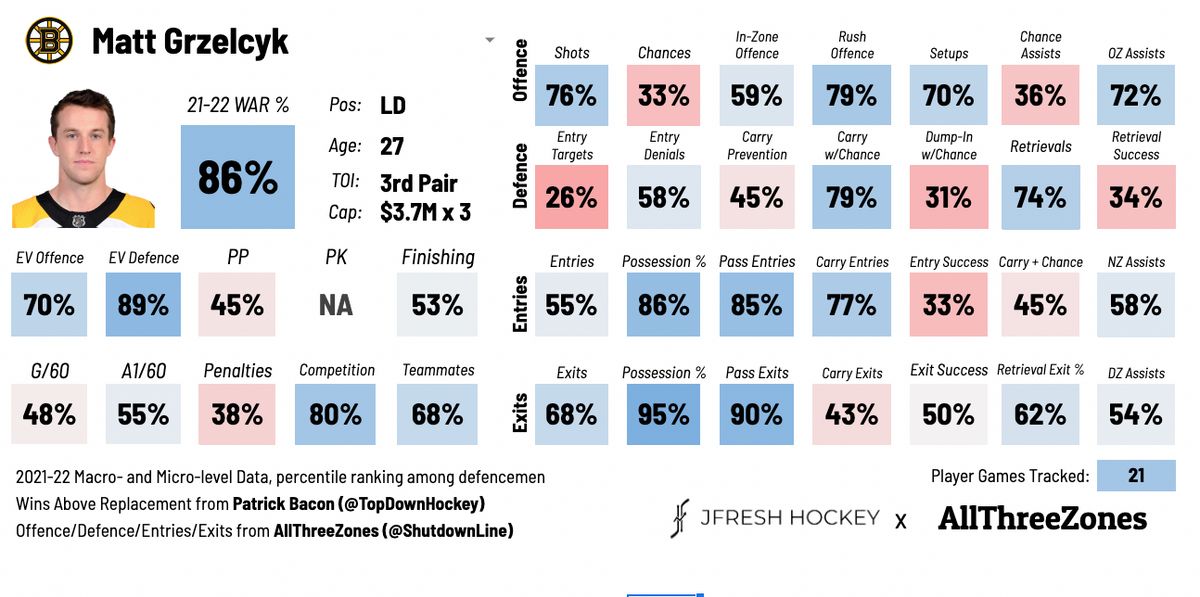
(As seen here in this impressive micro-stat chart created by JFreshHockey and Corey Sznajder, there’s an awful lot that can be gleaned from a player’s individual performance beyond just baseline stats).
Again, Cassidy and his staff aren’t going to be waving a micro-stats graph in a player’s face when it comes to assessing the shortcomings of their game — but the data doled out by Rogalski’s staff goes a long way toward giving Boston a clear look at their own play over an extended stretch.
“We'll get 10-day breakdowns of us versus the whole league in terms of expected, not expected (goals) — so basically it dictates how you're playing and then they actually label it. …. So you can sort of see where your team is over a stretch of time. And you could probably make those five-game segments, whatever you want. We've chosen 10, because that's a fairly accurate number of data that you can sort of say, 'Okay, are there tendencies developing in our game that we like and don't like.' So that's how we use them.”
———
Cassidy has been candid when it comes to how analytics has changed his thinking on several on-ice topics, especially as it pertains to defending the blue line and limiting the number of clean entries that Boston would once relinquish to the opposition.
But that doesn’t mean that Boston’s entire coaching operation revolves around data sets and those pesky columns, either. Like any effective coaching staff, Cassidy and his crew use every possible outlet and avenue to paint a complete picture regarding both their opponent and their team’s own play on the ice.
And with Rogalski and his team in place, Cassidy and the Bruins' coaches should continue to have plenty of tools at their disposal when it comes to putting their players in the best possible position to succeed.
“We're stubborn a little bit, we like to trust our eyes, and I think that's what analytics is good for,” Cassidy said back in 2019. “It gives you an unbiased opinion. … I like looking at data and then using it accordingly. I don't get married to the — so many controlled entries, which is much higher than normal — but you do have to use certain points of it to reinforce the things you're teaching.”
Stats and graphs via Natural Stat Trick, HockeyViz and JFreshHockey.